Traffic
Road closures, construction and event traffic affecting campus.
Platforms
- iOS
- Android
Partners and Data Sources
- Facilities Information and Technology Services: GIS
- Traffic and Transportation Management
Screen Views
Views range from 1,411 in 2021 to 18,266 in 2025, with a peak of 19,133 in 2024.
| Year | Screen views |
|---|---|
| 2021 | 1.4K |
| 2022 | 14.6K |
| 2023 | 17.8K |
| 2024 | 19.1K |
| 2025 | 18.3K |
Features and Screenshots
All Impacts
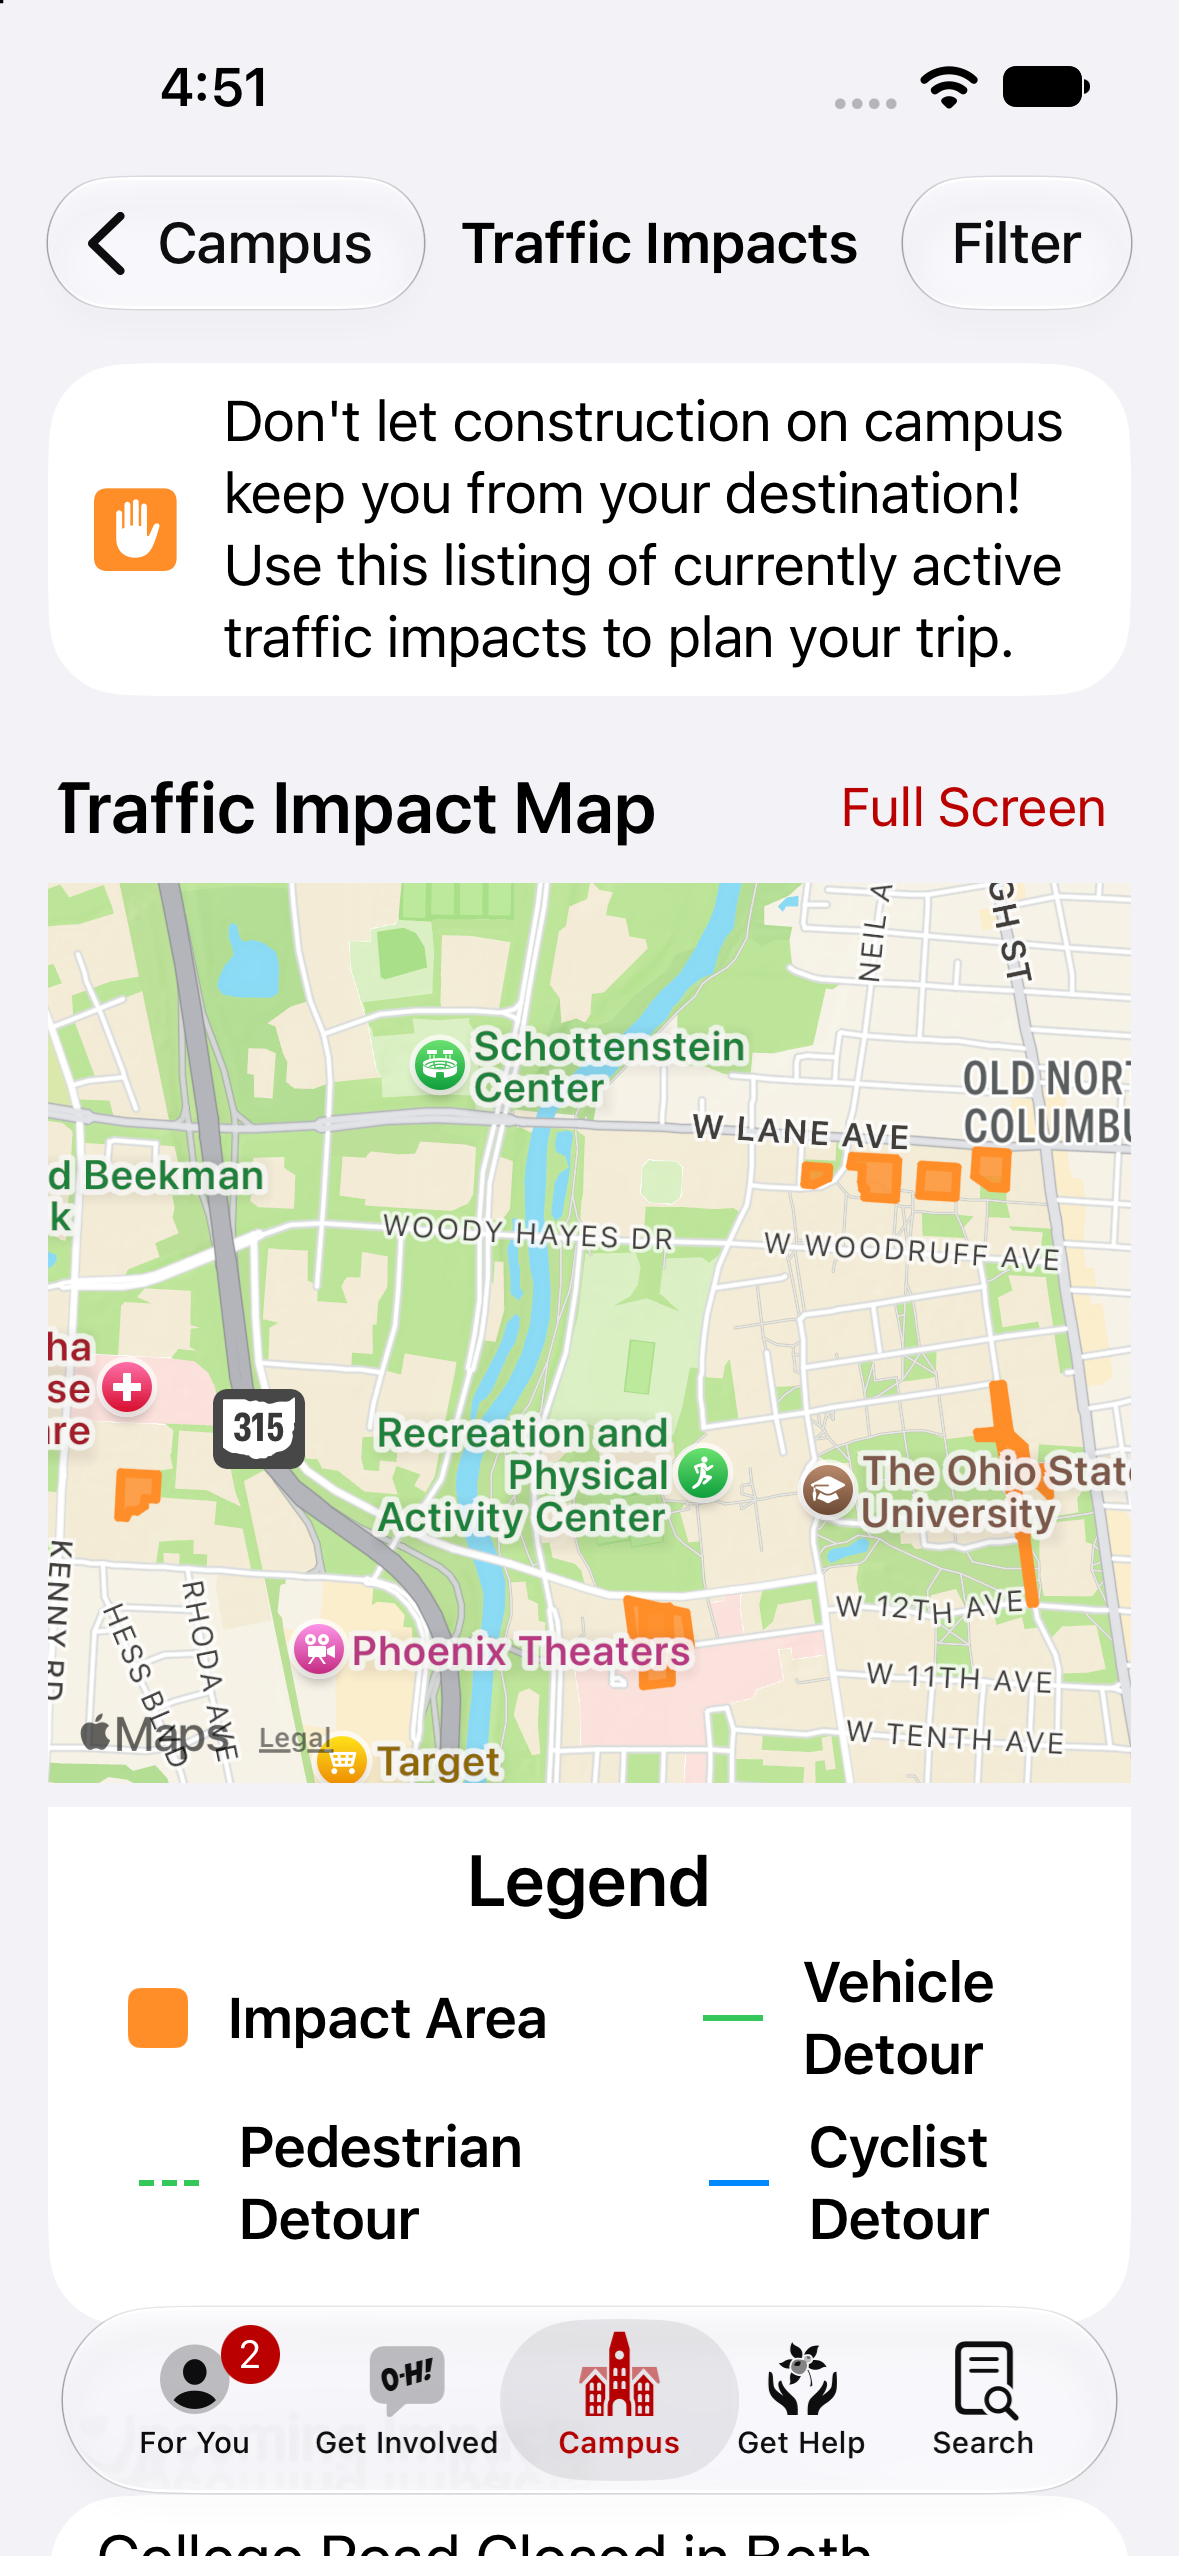
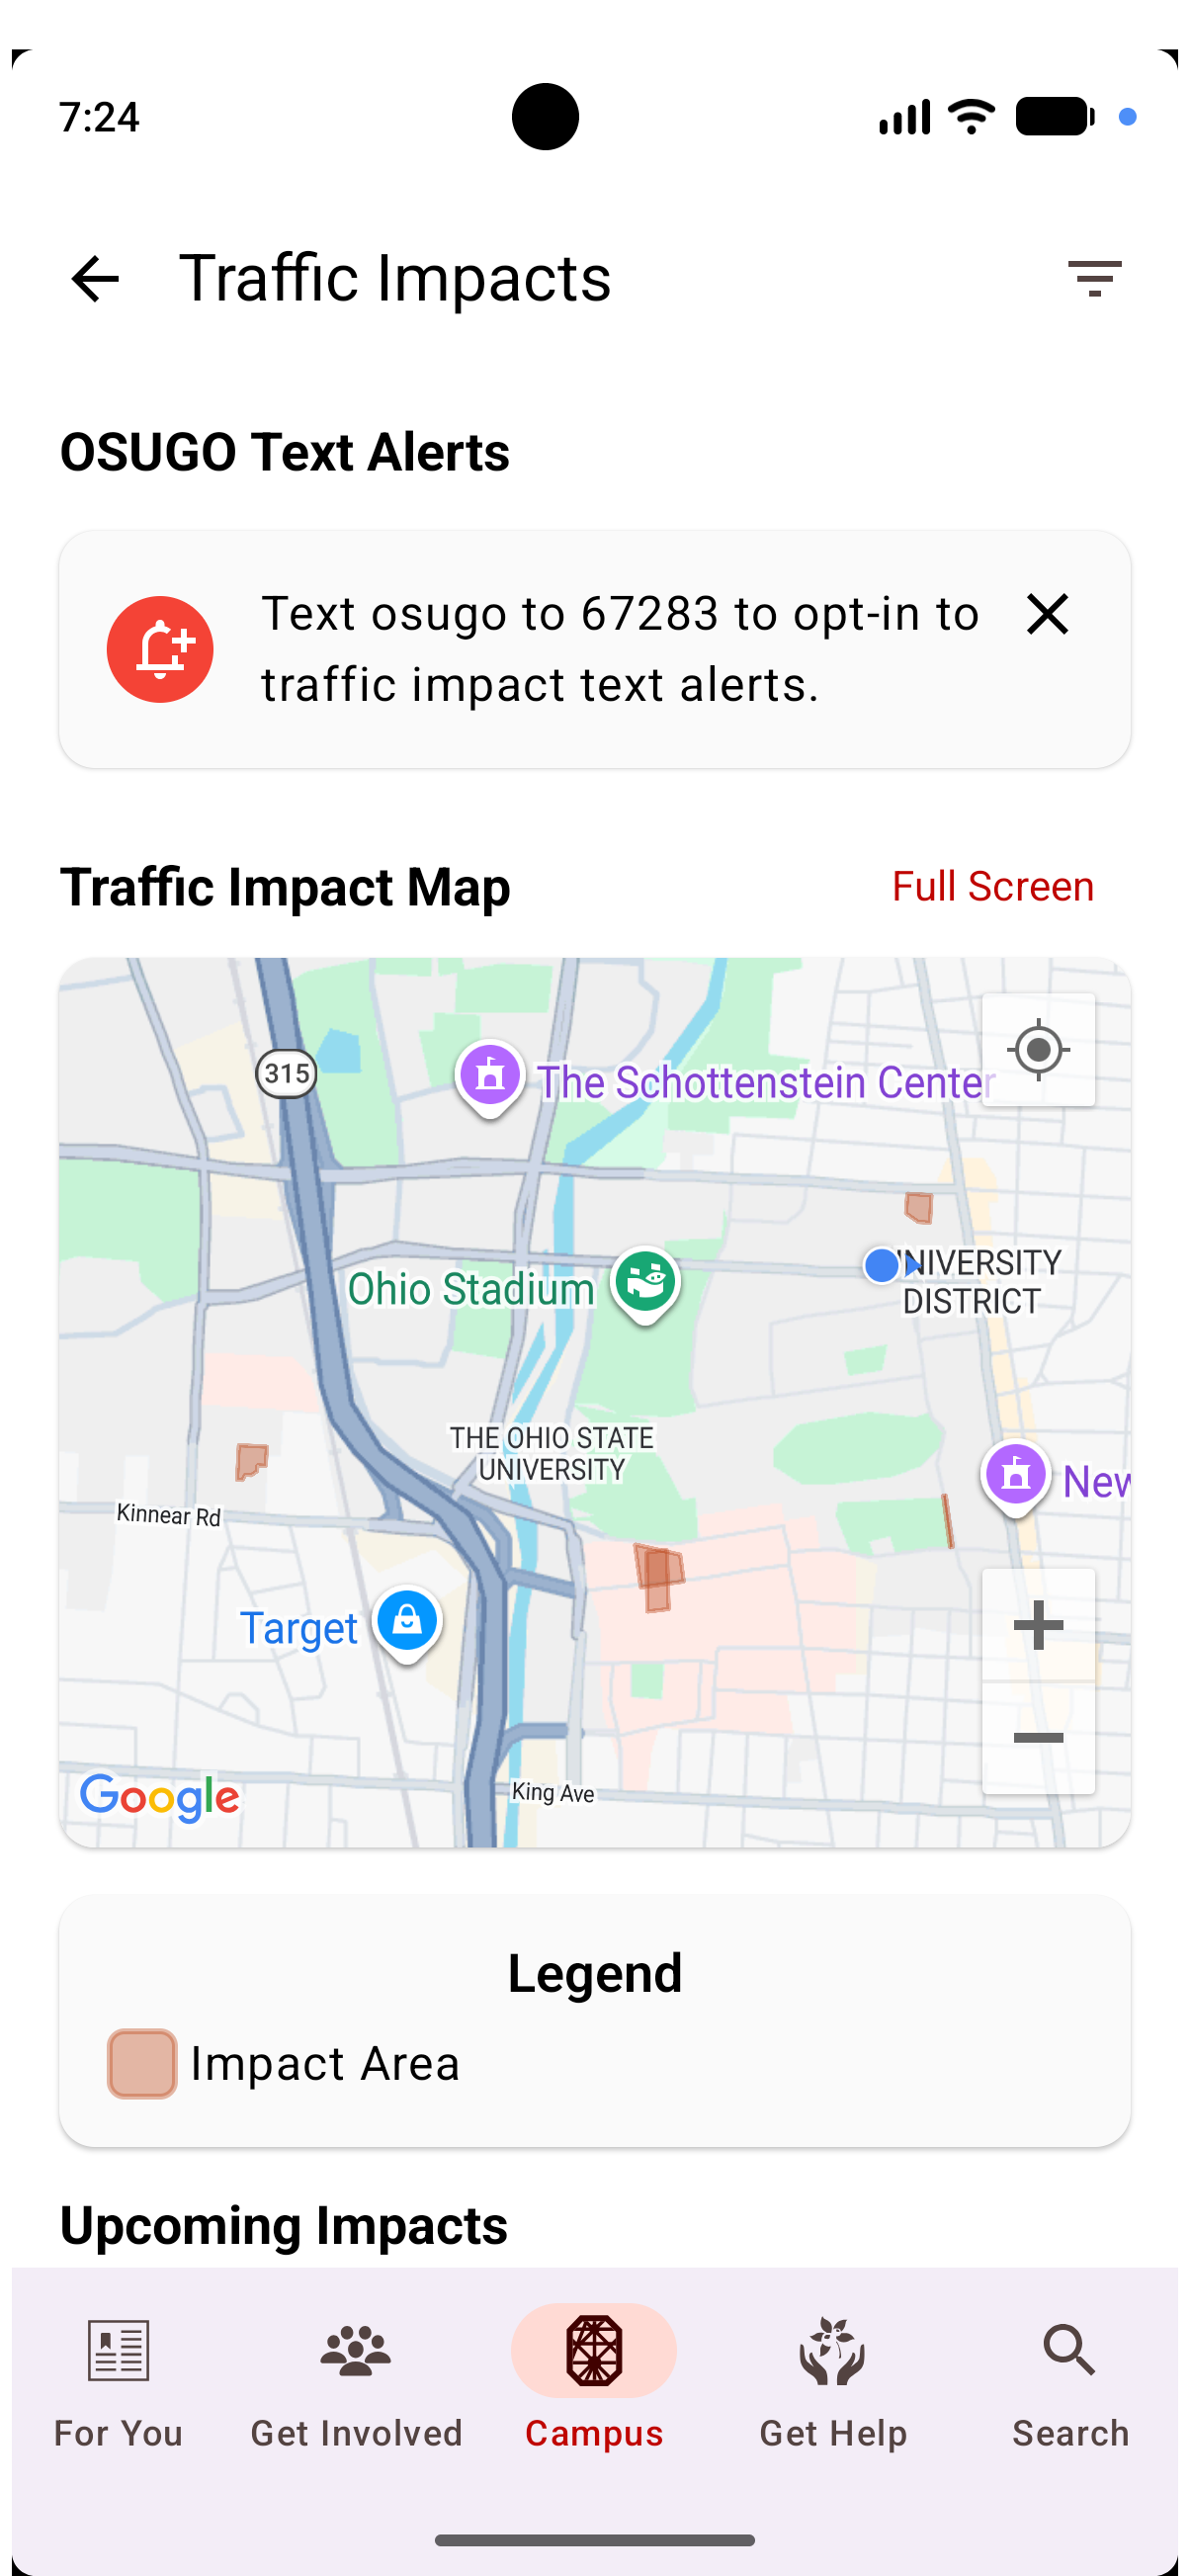
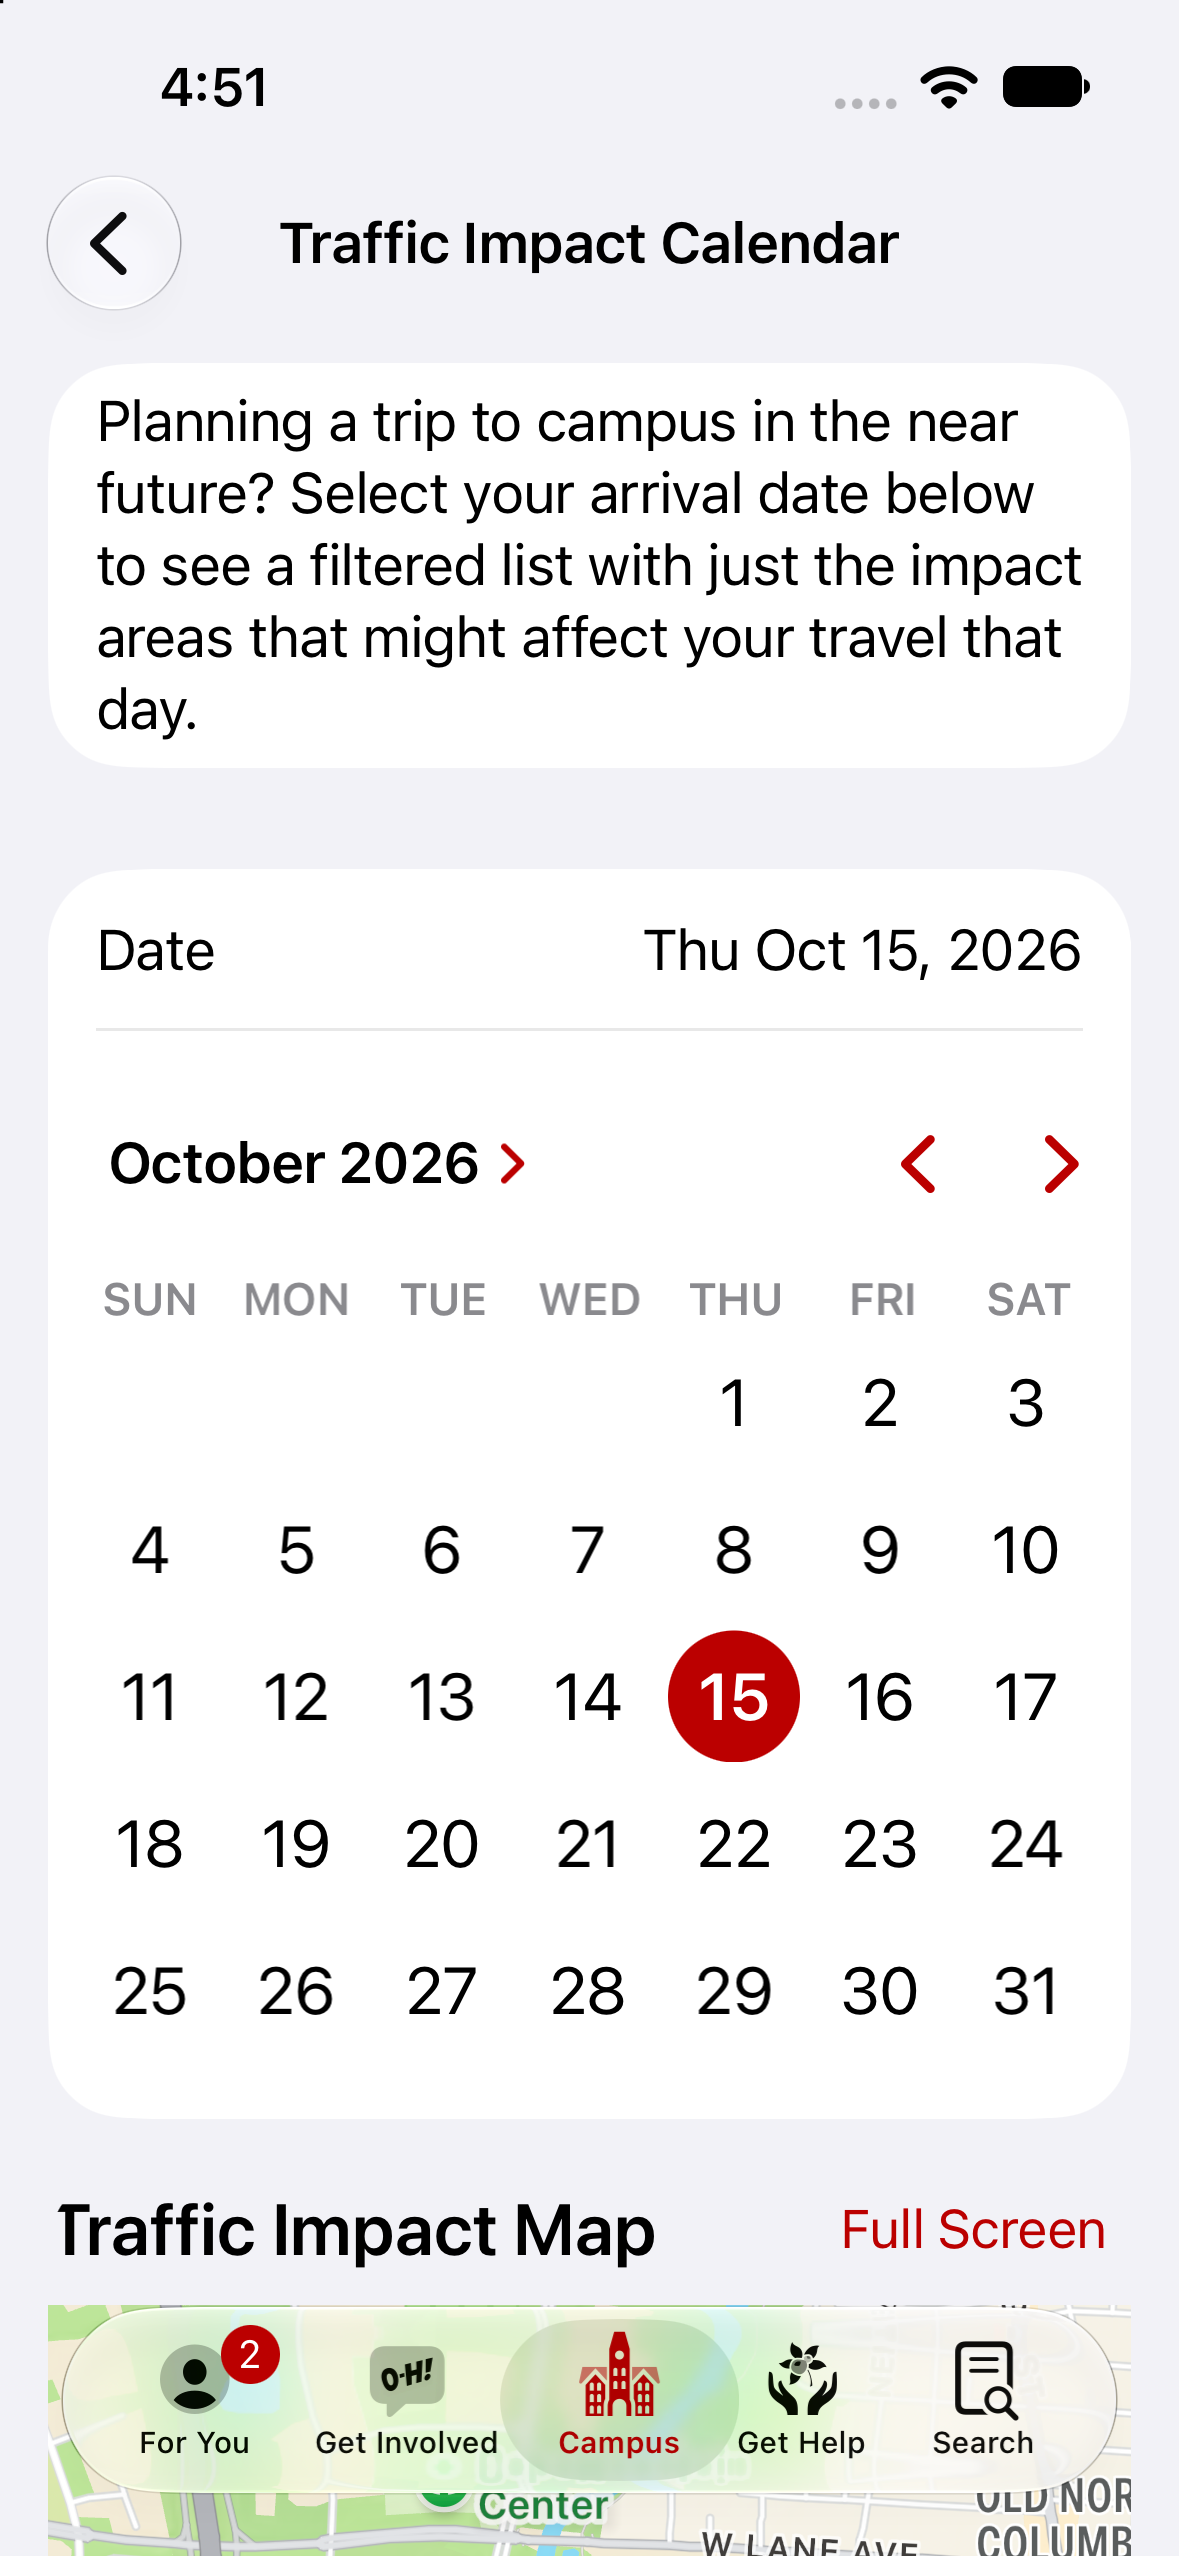
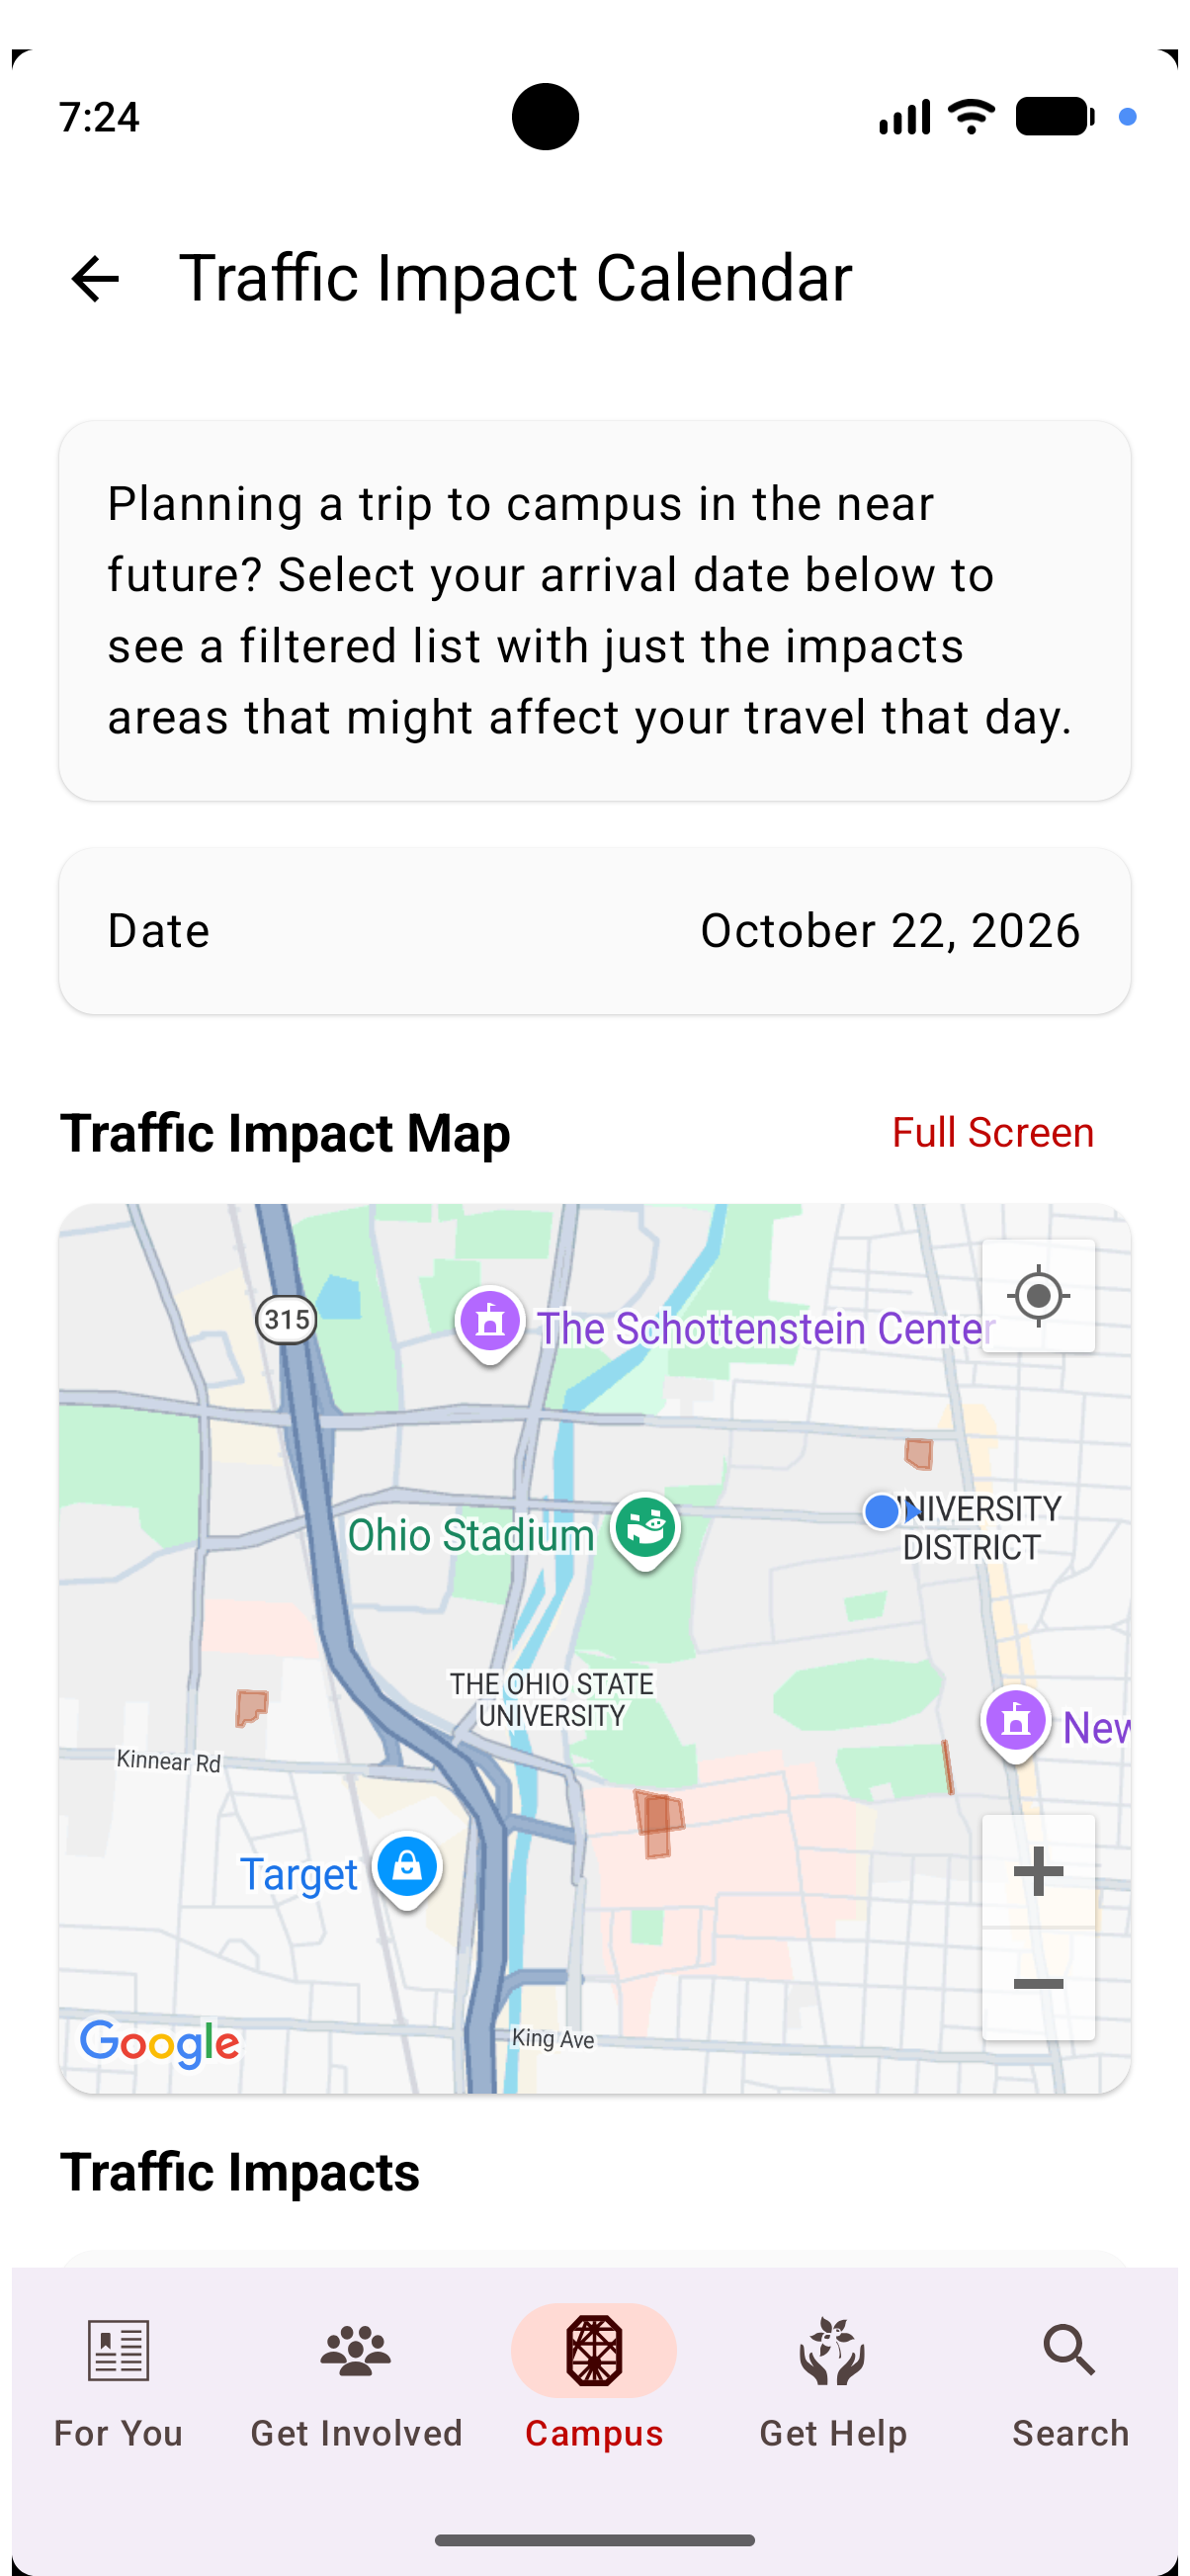
We allow users to visualize traffic impacts in several ways. We have an impact map that shows what’s happening now, and also a traffic impact calendar that allows you to jump forward in time and see what navigating campus will be like in the future.

Full Detail
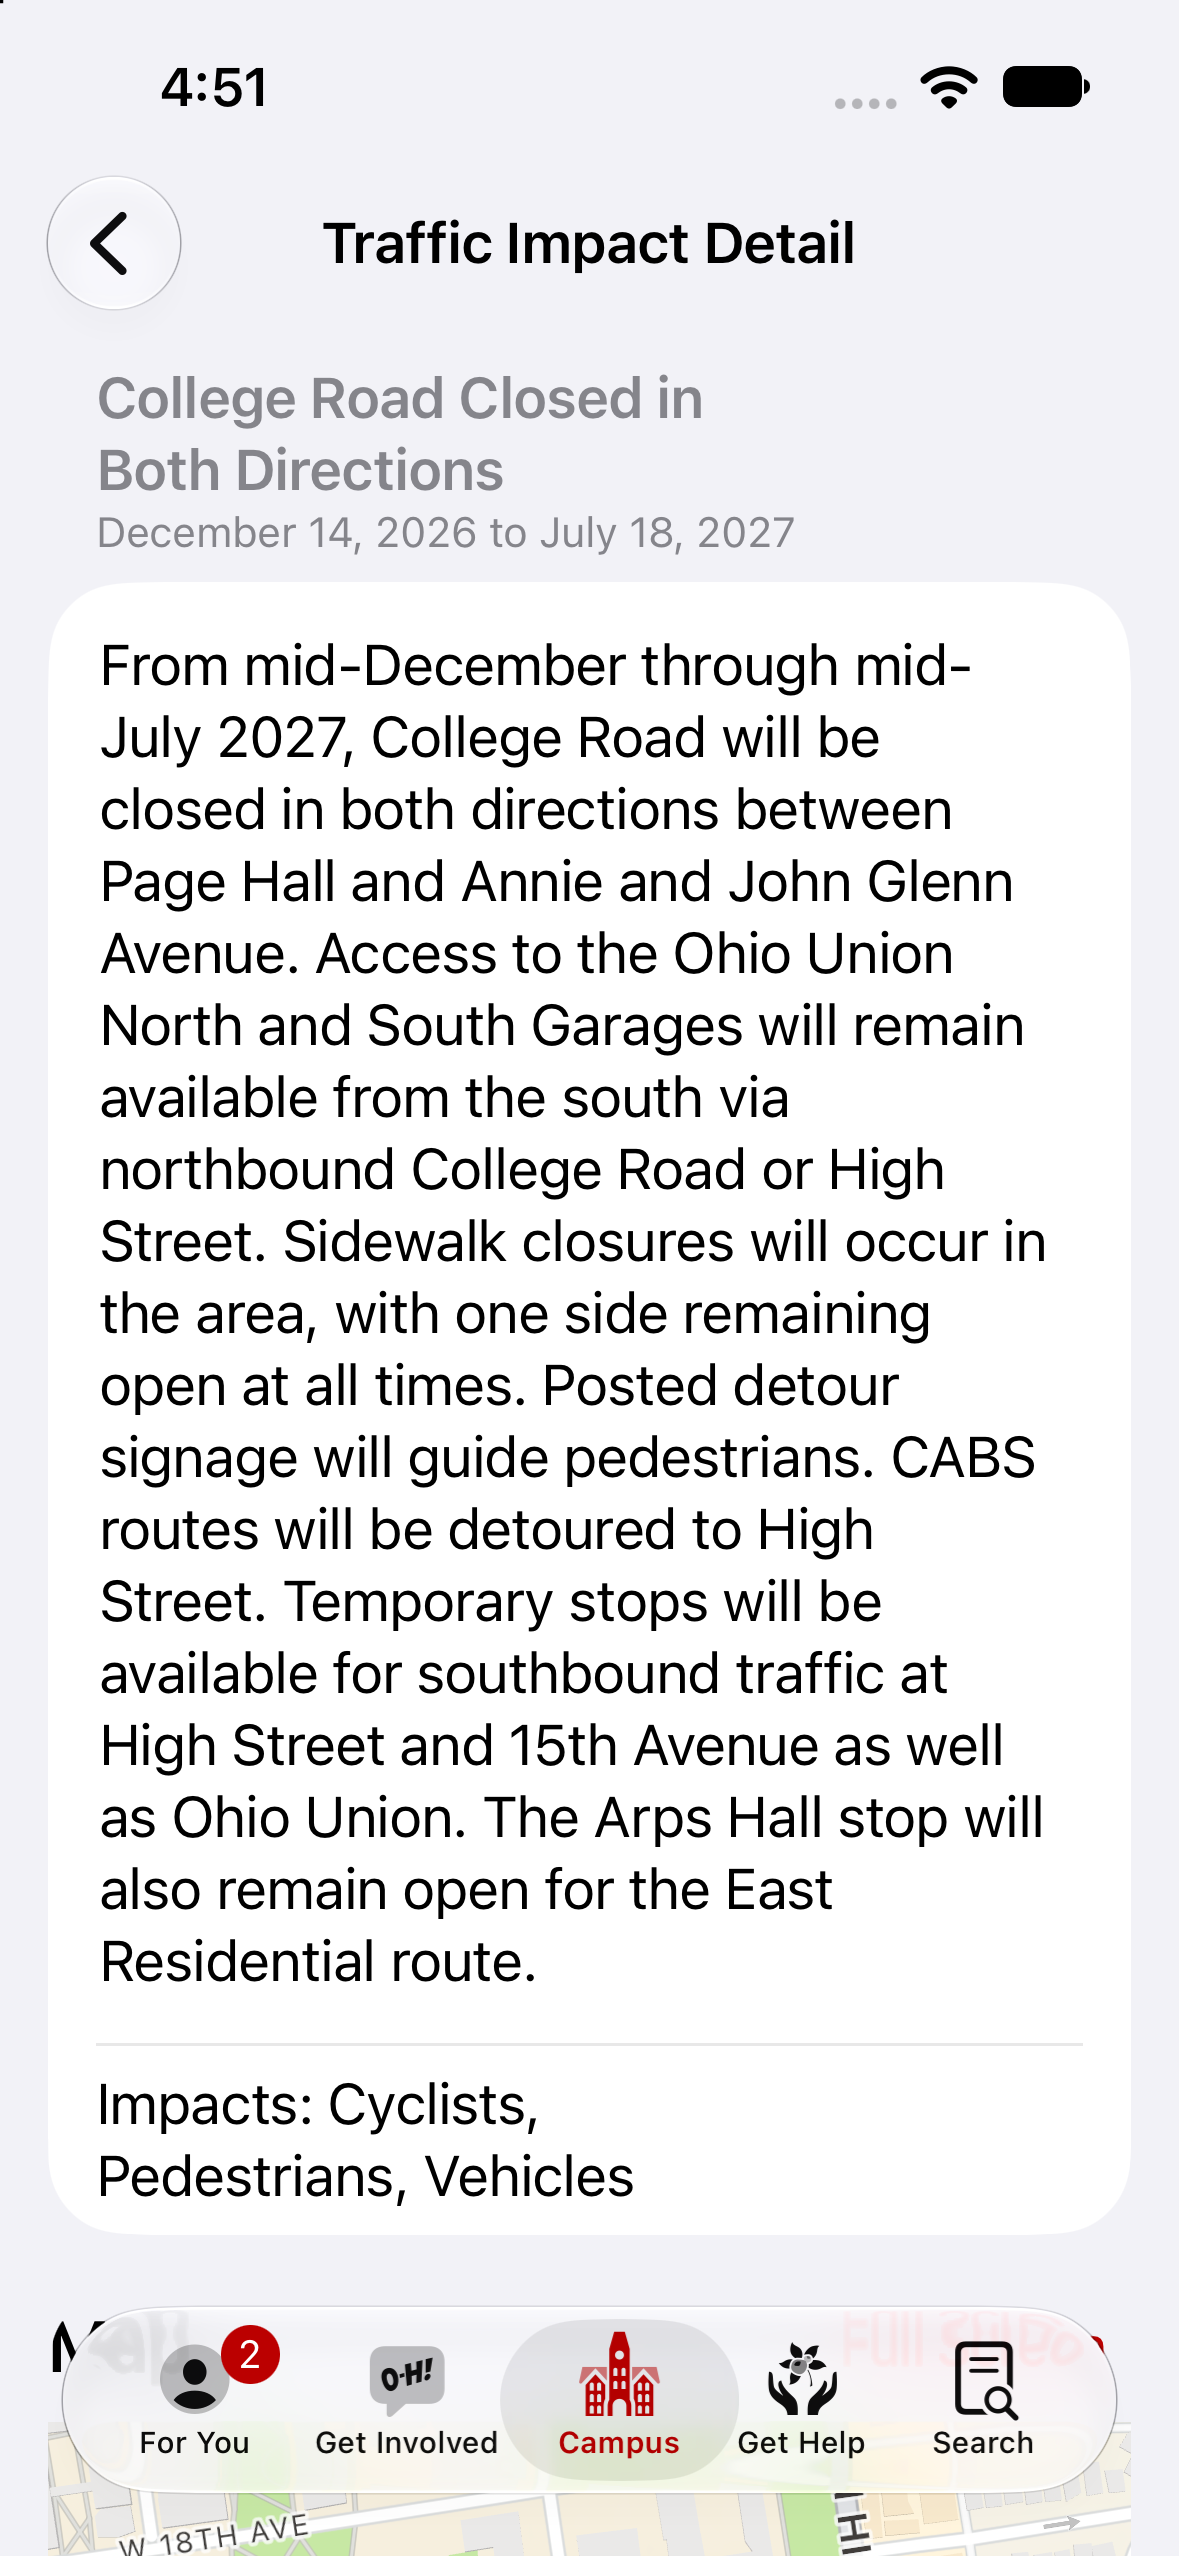
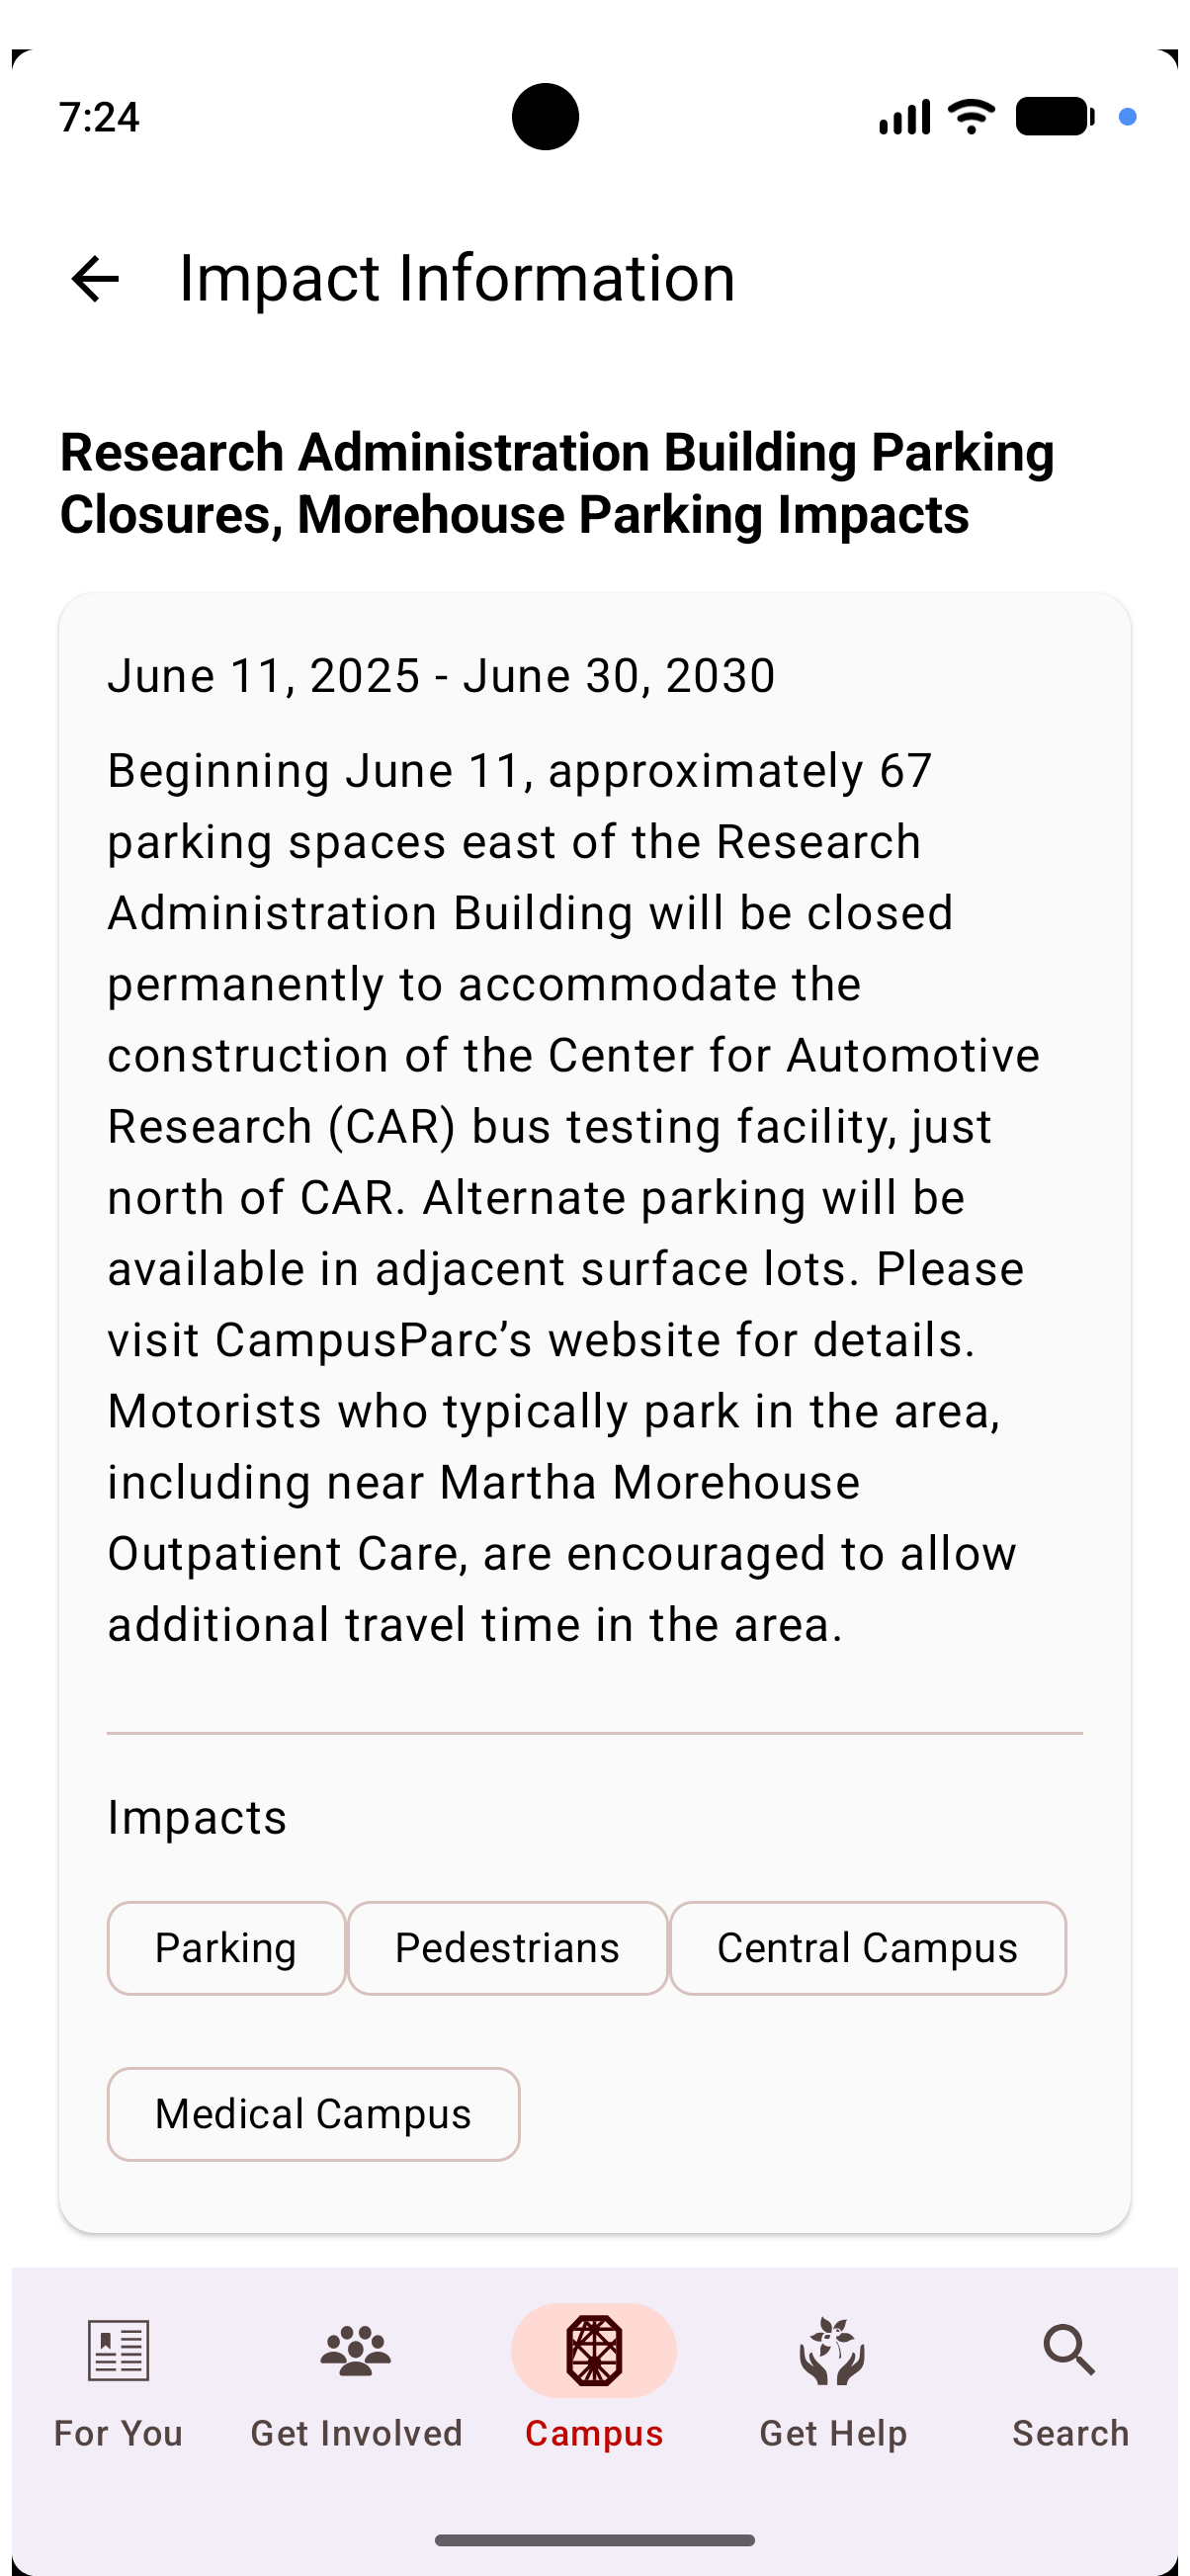
Each impact will have a time range, a description of what is going on, and many times a suggestion for an alternate route.
This feature isn't documented on Buckeye Link yet. Try another option from the Platform toggle at the top of the page.